
Wearable Footstrike Analysis For Runner Injury Prevention
14th Sep•10 min read
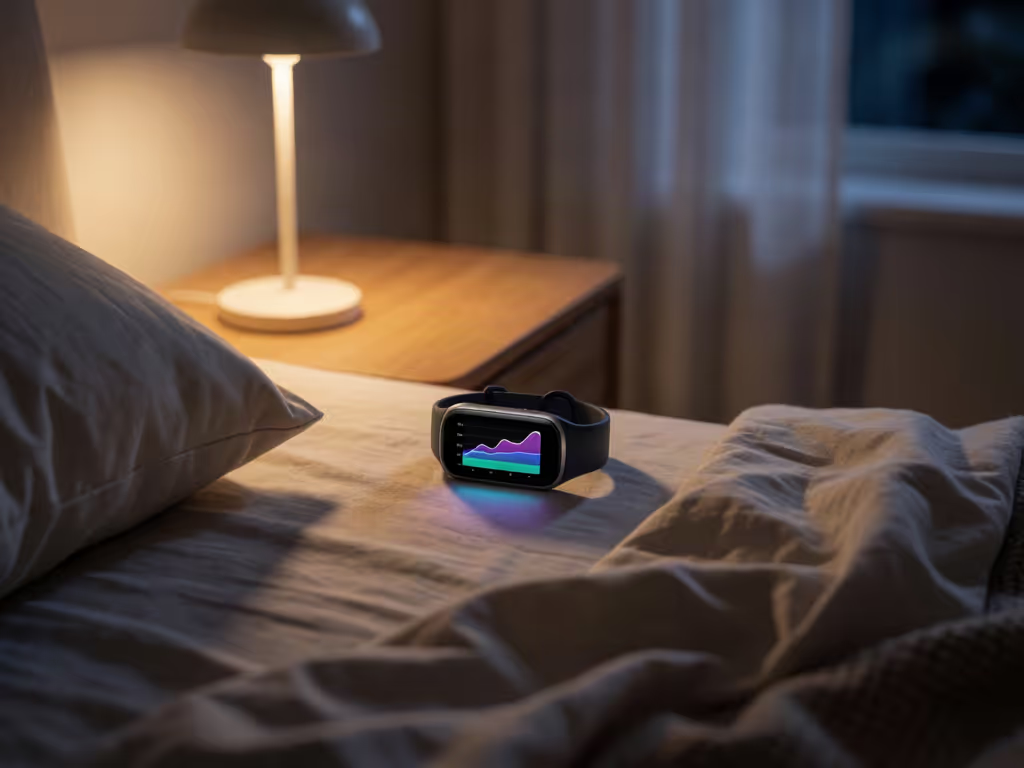
Sleep trackers can reveal longer-term patterns, but their stage charts are estimates—not direct readings of brain activity or clinical sleep tests.
Important: The available evidence does not provide a device-agnostic target for deep-sleep minutes or a normal consumer sleep score by age, so a single number cannot establish whether your sleep is adequate.
If you have ever opened an app after a rough night and wondered whether its chart is telling the truth, you are not alone. How sleep tracking works and what sleep stage monitoring can realistically tell you are easier to understand once you separate a useful estimate from a clinical measurement. Your tracker can help you notice patterns in your own routine; it cannot read your mind (or directly read your brain activity) while you sleep.
A stage chart can look wonderfully precise: blocks of light, deep, and REM sleep arranged neatly across the night, often paired with a score. That tidy presentation can create pressure when your lived experience does not match the number. The better approach is gentler: use the data to ask useful questions, then build a routine that fits your actual life.
Small, repeatable wins beat flashy charts and streaks.
Many people assume a wearable sees sleep stages the way a sleep laboratory does. It does not. The reference method for assessing sleep is polysomnography, often shortened to PSG. In that setting, sleep staging uses multiple recorded signals, including brain activity (EEG), eye activity, and muscle activity. Additional measurements can include heart activity, breathing, leg movements, oxygen desaturation, and body position.
PSG scoring labels each 30-second segment as wake, N1, N2, N3, or REM sleep. For a deeper look at how fitness trackers measure sleep, including the science behind their estimates, see our dedicated guide. In everyday language, sleep is commonly described as cycling through light sleep, deep or slow-wave sleep, and REM sleep. Those consumer-friendly labels are helpful shorthand, but they are not proof that your wearable measured the same signals as a PSG study.
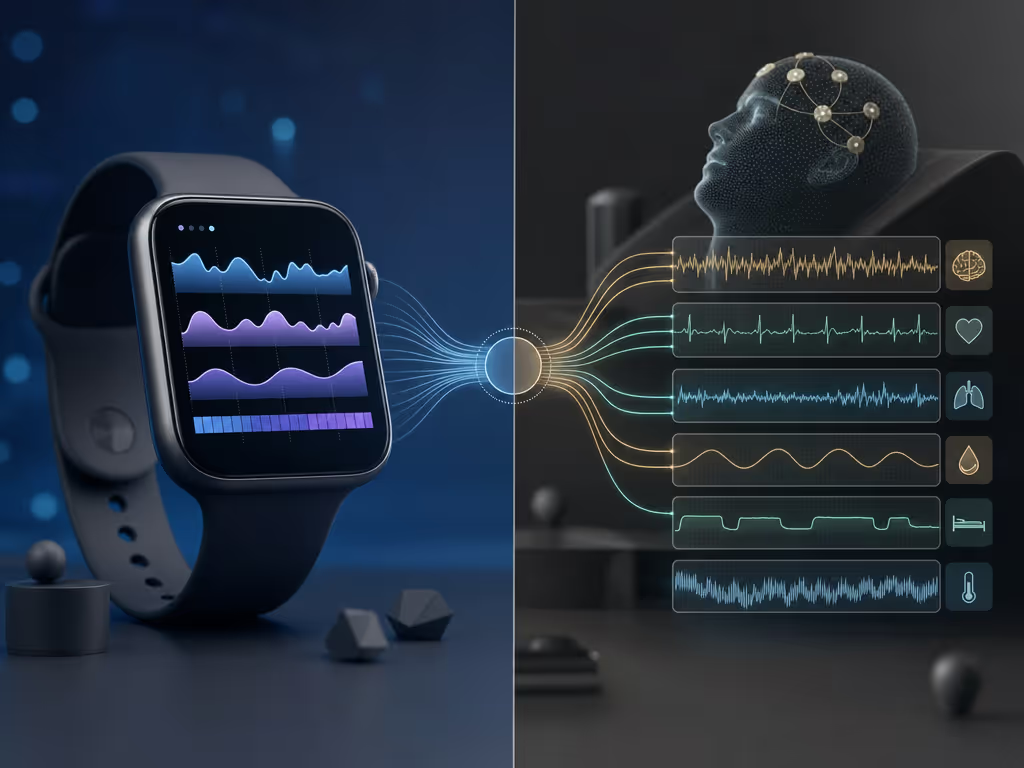
A consumer tracker generally gathers indirect clues. Depending on the device, that may include movement, heart rate, heart-rate variability, skin conductance, or temperature. Wrist wearables often use photoplethysmography (PPG): skin-side lights that track changes in blood passing through the wrist. Software then combines available signals to estimate when you were asleep and which stage label may fit each portion of the night.
That distinction matters. A tracker is making an informed inference from patterns; it is not directly recording the brain, eye, and muscle signals used to formally score sleep stages.
Movement-based estimation has a straightforward blind spot: it tends to treat movement as wake and stillness as sleep. If you lie awake, calm and motionless for a long time, a motion-based system can label some of that wakefulness as sleep.
Adding pulse-related and other signals can give an algorithm more context, but it does not make every stage block certain. Validation findings for one model, algorithm, participant group, or software version should not be generalized to all wearables. Many consumer algorithms are proprietary, and companies can change them without notice. That can complicate interpretation of long-running data and comparisons across models or software periods.
This is where a lot of unnecessary worry begins. You may remember being awake at 3 a.m., while the app says you slept. Or you may wake feeling reasonably refreshed and see less "deep" sleep than you expected. Neither situation means you failed at sleep. It means the chart is one imperfect perspective on a complex biological process.
For some people, trying to engineer a perfect score can add stress that works against rest. I once helped a nurse on rotating nights quiet the alerts that were making every daytime sleep feel like a poor grade. A calmer wind-down vibration and a weekly view made the data feel supportive again. Your schedule deserves that same flexibility.
The evidence supports using sleep tracking to observe longer-term, within-person trends. A nightly chart is best treated as an estimate rather than a final verdict.
Instead of asking, "Was my deep sleep number good?" try asking:
Compare the estimates with your own routine and daytime experience. For another perspective on interpreting tracking data, see our night-shift sleep tracking guide.
Use this four-step check-in once a week rather than trying to decode every morning's graph:
This is sleep quality measurement with context. The stage chart is a supporting detail, not the headline.
If your app displays a "debt," readiness, or recovery summary, explore our guide to decoding recovery metrics. Focus instead on longer-term estimated sleep trends rather than treating a single summary as a clinical measure.
For adults ages 18-60, the CDC lists seven or more hours per day as a population-level recommendation. That is useful background, not a demand that every night look identical. More importantly, enough time and good quality are distinct: repeated awakenings, trouble falling asleep, or feeling sleepy or tired despite enough sleep can all matter.
These labels describe parts of the cycling sleep pattern an app is trying to estimate. "Deep sleep" often corresponds to slow-wave sleep in consumer language; PSG uses the label N3 within its wake, N1, N2, N3, and REM framework.
What you can do is notice whether your own estimates look markedly different over time alongside changes in routine or how rested you feel. What you cannot reliably do is use a consumer deep-sleep minute total to determine whether you are getting enough N3 sleep. There is no device-agnostic target in the available evidence for "enough" deep sleep from a tracker.
The available evidence does not define or validate normal consumer sleep-score cutoffs or age-based ranges. A proprietary score is not a clinical measure.
A score can be a convenient dashboard shortcut if it leads to a kind, practical decision. If it makes you override how you feel or chase a perfect result, hide it for a while and return to the basics.
Kind routines, clear settings are often more valuable than another dashboard tile. If your tracker allows it, consider turning off badges that create pressure, using a quiet wind-down cue, and choosing a weekly trend view over frequent score checks.
A consumer tracker should not be used alone to identify sleep apnea. If breathing disruptions are a concern, our review of sleep apnea tracking offers additional context. If sleep problems or related symptoms occur regularly, the CDC advises discussing them with a healthcare provider.
A simple sleep diary can make that conversation clearer. Over two weeks, record items such as bedtime, wake time, nighttime waking, naps, exercise, alcohol or caffeine use, and medications. That lived record may be more useful in a clinical discussion than trying to explain every colored block in an app.
A consumer tracker's deep-sleep figure is an estimate, not a clinical measurement of N3. There is no universal, evidence-backed threshold in these data for deciding whether 40 minutes is enough. Look at longer patterns and your daytime experience rather than judging one number in isolation.
Not reliably. Formal N3 identification comes from PSG scoring using recorded physiological signals. A wearable offers an estimate, and the available evidence does not provide an observable at-home method for identifying N3 in another person.
Current PSG labels in the evidence are wake, N1, N2, N3, and REM. The historical use of "stage 4" is not addressed here, so it is safest to use the stage names your clinician or current sleep report uses rather than assuming terms match across sources.
In the CDC age table, newborns aged 0-3 months have the highest listed recommended range: 14-17 hours across a 24-hour day.
Tonight, leave the stage chart alone. At the end of the week, review your estimated sleep timing and interruptions beside one sentence about how you felt during the day. Then choose one supportive setting or routine (perhaps fewer sleep notifications or a more consistent wind-down cue) and keep it simple for the next week.
Your tracker is most helpful when it reduces friction, respects changing seasons of life, and helps you notice patterns without turning rest into a performance. For practical ways to turn those observations into sustainable routines, see our guide to building better tracker habits.